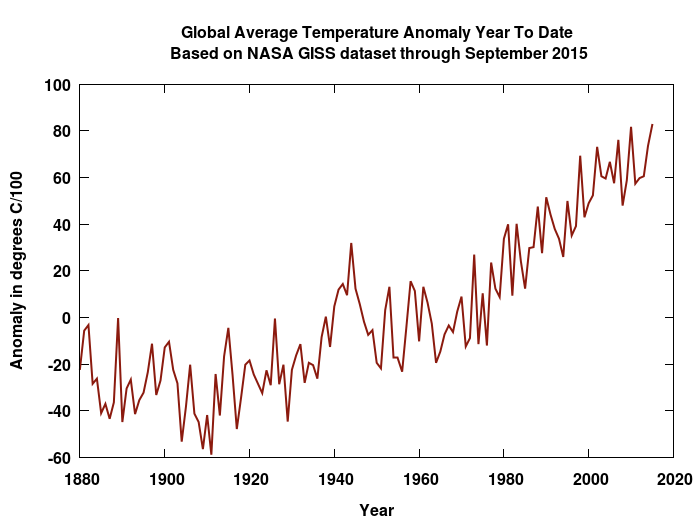
Here are two current graphs reflecting NASA GISS global surface temperature data. See this.
![giss_12-month_moving_average](https://i0.wp.com/gregladen.com/blog/wp-content/uploads/2015/10/giss_12-month_moving_average-650x487.png?resize=600%2C450)
![giss_FirstMonthsOnly](https://i0.wp.com/gregladen.com/blog/wp-content/uploads/2015/10/giss_FirstMonthsOnly-650x487.png?resize=600%2C450)
In Search of Sungudogo by Greg Laden, now in
Kindle![](//ir-na.amazon-adsystem.com/e/ir?t=grlasbl0a-20&l=am2&o=1&a=B07VNYG16T)
or
Paperback
*Please note:
Links to books and other items on this page and elsewhere on Greg Ladens' blog may send you to Amazon, where I am a registered affiliate. As an Amazon Associate I earn from qualifying purchases, which helps to fund this site.
Like this:
Like Loading...